


The claim
The Albanese government came to power promising to get wages moving again.
After a year in office, Treasurer Jim Chalmers claimed the government had achieved exactly that.
“[Labor] said that we’d get wages moving again, and we are,” he told parliament on September 11.
“An average full-time worker was $3,700 better off in the first year of the Albanese government.”
Is that correct? RMIT ABC Fact Check investigates.
The verdict
Mr Chalmers’s claim is misleading.
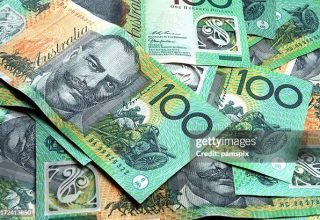
According to the Australian Bureau of Statistics, total average weekly earnings for full-time employees increased by 3.9 per cent — or $3,738.80 — over Labor’s first year in office.
However, experts pointed out this figure ignored the impact of inflation which outstripped the growth in earnings by 6 percentage points over the year to June 30 as measured by the consumer price index (CPI).
In real terms, full-time total average weekly earnings fell by 2 per cent over the year to May 2023.
Rather than employees being “better off”, average full-time wages actually fell in real terms by $2,012.92 over Labor’s first year in office.
Experts said average earnings could also be adjusted to the rate of the bureau’s selected living cost indexes (SCLIs) which are designed to measure inflation in a more targeted way and include the costs associated with interest paid on mortgages.
On this basis, inflation for employee households rose to 9.7 per cent and resulted in the purchasing power of total wages going backwards by $5,470.40 a year.
Similar results were produced when ordinary earnings, which exclude overtime, are considered.
A familiar talking point
Mr Chalmers took to Twitter the same day with a similar claim: “the average full-time worker is earning about $3,700 extra a year”.
But he wasn’t the only one claiming wages had experienced a boost under Labor, with other Labor MPs also claiming that the average full-time worker was “better off”.
For example, Minister for Aged Care and Sport Anika Wells suggested on September 9 that an average full-time worker was “approximately $3,700 better off than they were 12 months ago”.
Meanwhile, Labor MP Carina Garland claimed Australians had earned an “extra” $3,700 in the government’s first year while fellow MP Sam Rae put a motion to the same effect on September 12.
The Labor member for Bennelong, Jerome Laxale, put it a little differently arguing: “That’s about $3,700 going straight back into Australian workers’ pockets.”
Tracking average wages
Experts told Fact Check the best measure of assessing the dollar value of wage growth was the ABS’s average weekly earnings data.
Average weekly earnings provide a quarterly snapshot of the dollar value of average pay packets across the country.
Previously, Fact Check has relied on the wage price index (WPI) to measure wages growth, which shows changes in average hourly wage and salary costs uninfluenced by compositional or structural changes within the workforce.
Janine Dixon, a former survey manager at the ABS and a senior research fellow at Victoria University’s Centre of Policy Studies, said that while the WPI was the best measure to make a like-for-like comparison of wages growth, it didn’t account for earnings associated with moving into higher-paid occupations.
As an index, the WPI also measures percentage changes over time rather than publishing changes in the dollar value of average wages, as was claimed by Mr Chalmers.
Fact Check has therefore relied on average weekly earnings data to assess the Treasurer’s claim.
The ABS publishes both “original” and “seasonally adjusted” data. The latter removes regular calendar-related variations to more clearly reveal underlying movements and has been used in Fact Check’s analysis.
What the wage data shows
When Labor won the election in May 2022, the ABS data showed total average weekly earnings for an adult employee working full-time to be around $1,838.30, or $95,591.60 annually.
The latest available data shows that by May this year the figure had risen by 3.9 per cent to $1907.20 ($99,174.40 per year) — a weekly increase of $71.90, or $3,738.80 annually.
The ABS also publishes another measure of “ordinary” earnings, which excludes overtime hours worked.
On this basis, average full-time workers earned $1,838.10 per week in May 2023 ($95,581.20 annually), up from $1,769.80 ($92,029.60 per year) in May 2022.
That’s equal to a 3.9 per cent increase, or $68.30 a week ($3,551.60 annually).
But what about inflation?
Mr Chalmers claimed workers were “better off” because of increases to average weekly earnings under Labor’s watch.
But as John Hawkins, a senior lecturer at Canberra University’s School of Politics, Economics and Society, pointed out, this ignores the impact of inflation over the same period.
In order to understand the real value of changes to weekly earnings, David Hayward, an emeritus professor of public policy at RMIT University, said it was necessary to adjust for inflation, best represented in the ABS’s consumer price index (CPI).
The CPI measures the quarterly change in a group of common goods and services across Australia’s capital cities including housing, transport, health and food.
Although this data, most recently published for the June quarter, doesn’t exactly align with average weekly earnings data for the year to May, experts noted that it made for a reasonable comparison.
“The June quarter covers April, May and June, so it is ‘centred’ on May,” Dr Hawkins said.
What the real wage data shows
According to the ABS data, consumer prices rose by 6 per cent over the year to June 2023, while average full-time wages grew more slowly, at 3.9 per cent.
Expressed in 2022-23 dollars, total average wages fell from $101,187.32 to $99,174.40 annually.
This means the increase in total average wages lagged rising costs by $38.71 per week or $2,012.92 over a year.
So, in real terms, average weekly total earnings slipped by 2 per cent in Labor’s first year.
For ordinary wages, average weekly earnings fell from $97,576.44 to $95,581.20, which is a decrease of $1,995.24 per year.
“Earnings have gone backwards, it’s as simple as that,” Professor Hayward said.
The unequal impact of inflation
As the bureau explains, CPI is a broad measure designed to calculate price inflation across the household sector as a whole.
But, as the experts pointed out, the effects of inflation are not always spread equally across society.
To account for this, Dr Hawkins said average weekly earnings could be also adjusted to the rate of “selected living cost indexes” published by the ABS.
These indexes are designed to measure inflation in a more targeted way across different types of households; for example, aged pensioners, those in receipt of other government payments or employees.
The ABS says a key difference in the way the SLCIs are calculated compared to the CPI is the treatment of the purchase cost of dwellings, durable items and use of financial services and credit.
Importantly, the SLCIs exclude the net cost of the purchase price of properties but include changes in the cost of interest paid on mortgages. Conversely, the CPI excludes interest costs but includes purchase prices.
The index for employee households rose much more dramatically at 9.7 per cent over the year to June compared to the broader CPI measure (6 per cent).
As a result, the real wages of these households were more significantly eroded by the impact of inflation.
In real terms, the purchasing power of the total earnings of full-time employee households was eroded by $105.20 a week, or $5,470.40 a year, when adjusted to the rate of SLCI employee index.
Ordinary earnings were eroded by $102.48 per week, or $5,328.96 annually, when adjusted using the employee index.
That was more than double the amounts recorded under the broader CPI measure.
Employees, not workers
Dr Dixon said it was also relevant to consider the scope of the ABS’s average weekly earnings survey.
While Mr Chalmers referred to full-time “workers”, the ABS data actually refers to employees, not workers.
“The statistic is based only on employees, and does not include self-employed persons (for example, Uber drivers) or business owners (for example, many tradespeople),” she noted in an email.
According to the ABS, there were 2.2 million independent contractors or other business owners in August 2022, accounting for 16 per cent of all employed people.
While the bureau does publish data on their median earnings, this information is only available as of August 2022, only months after Labor won office, with the next update due to be published in mid-December.


